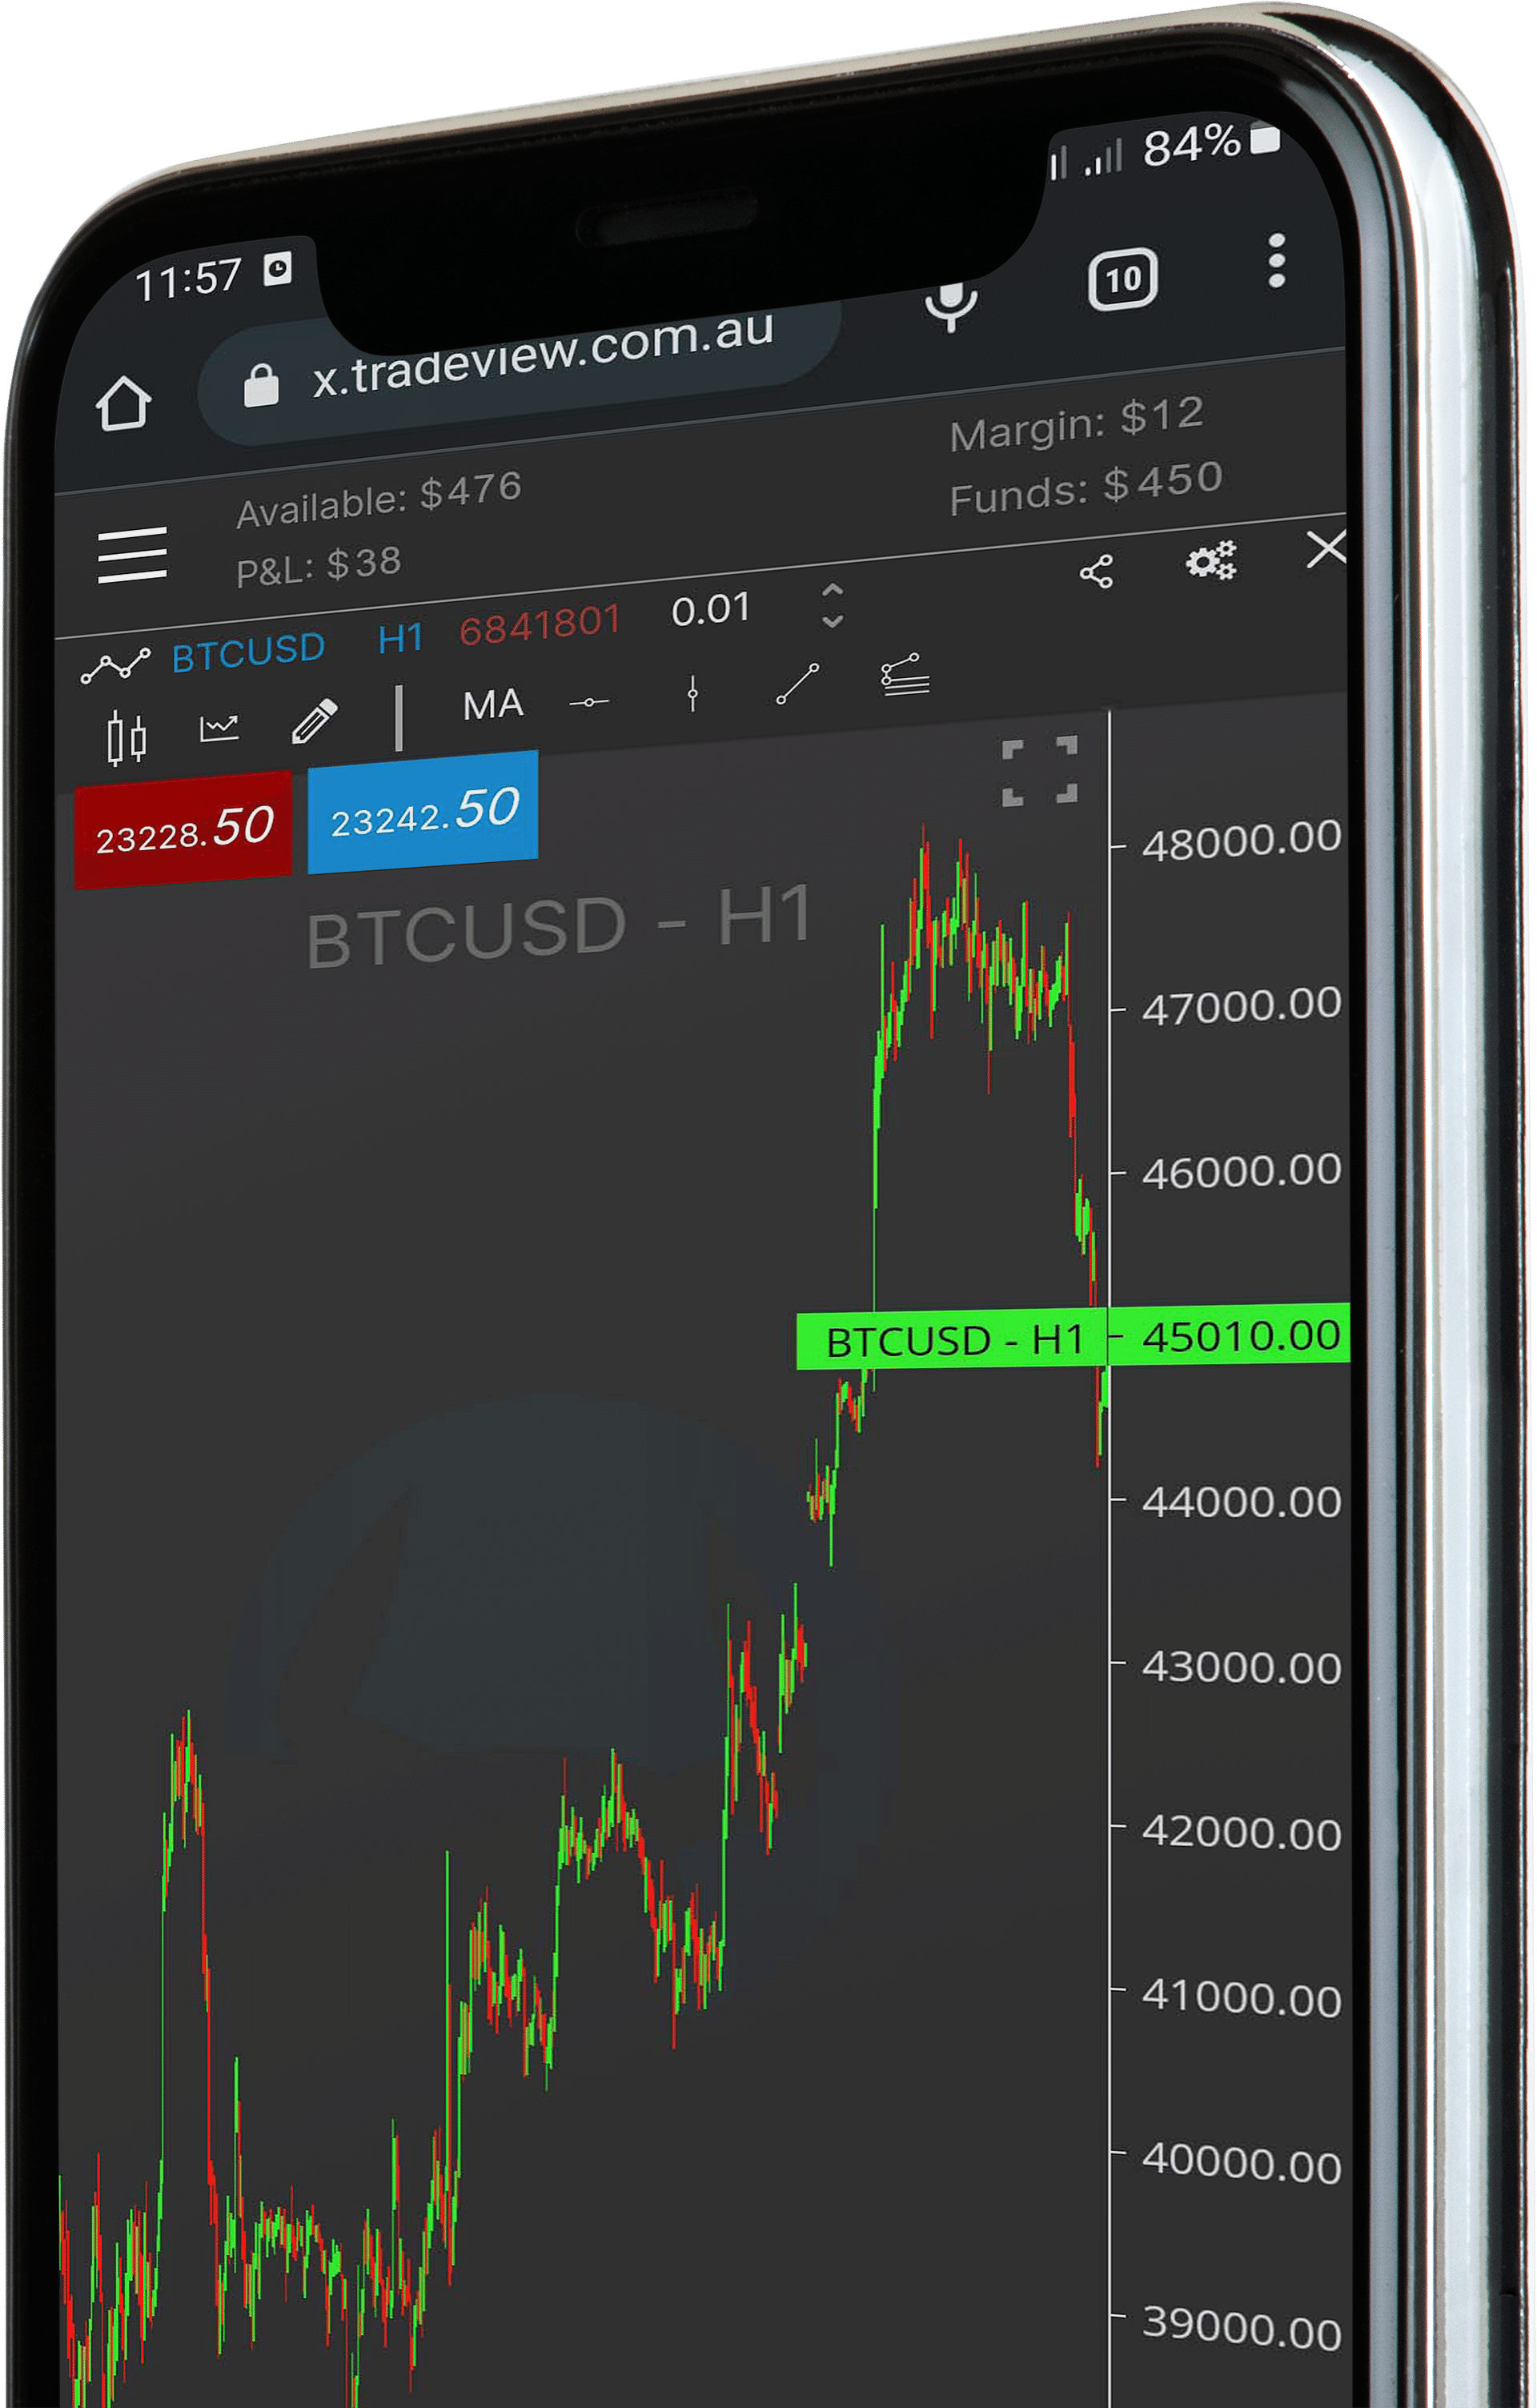
Ever wondered how to automate popular MACD indicator strategies? or How well would MACD work as a trading strategy?
In this Trading Talk episode Rey finds a MACD indicator strategy online and automates it without code to see the results.
The strategy is based on “The Best MACD Trading Strategy”
There are many MACD strategies online such as: What is the best macd setting for day trading?
If you would like to watch the episode in full to see how Rey automates the MACD strategy, check out the Trading Talks page.
This page will cover common MACD questions such as:
- What is the MACD indicator and how does it work?
- How to trade the MACD indicator Golden Cross?
- Common Mistakes: How not to use the MACD indicator
- How to use the MACD histogram and identifying momentum reversal
- How to scan for MACD crosses and crossing above zero
- How to automate the MACD indicator
What is the MACD indicator and how does it work?
The MACD indicator is a technical analysis tool that measures the relationship between two moving averages of prices. The indicator can be used to identify trends and trend reversals, as well as to measure the momentum of price movements.

MACD is calculated by subtracting the 26-day exponential moving average (EMA) from the 12-day EMA. The resulting line is then plotted on a separate graph, along with a nine-day EMA of the MACD line itself, which is used as a signal line to generate buy and sell signals.

MACD buy signals are generated when the MACD line crosses above the signal line, and MACD sell signals are generated when the MACD line crosses below the signal line. These signals can be used to identify potential trend reversals or confirm existing trends.
The MACD golden cross is created when the MACD line crosses above the signal line. This crossover indicates that the 12-day EMA has crossed above the 26-day EMA, and it is generally considered to be a bullish signal.
The MACD golden cross can be used to confirm trends and to generate buy signals.

MACD is a popular technical analysis tool that is used by many traders to help them make decisions about when to buy and sell securities. The indicator can be used to identify trends, confirm trends, and measure momentum. If you are new to trading, or if you are looking for another tool to add to your toolbox, the MACD indicator may be worth investigating.
Common Mistakes: How not to use the MACD indicator
The MACD indicator is a powerful tool that can be used to identify trends and momentum, but it is important to avoid making common mistakes when using this indicator.
One common mistake is to use the MACD line as a standalone indicator. The MACD line is only one part of the indicator, and it should not be used alone to make trading decisions. The MACD line should be used in conjunction with other technical indicators, such as support and resistance levels, RSI, and stochastics to confirm trends and make trading decisions.

Another common mistake is to use the MACD indicator without considering the timeframe of the chart being analyzed. The MACD indicator works best on longer timeframes, such as daily or weekly charts, so it is important to consider the timeframe of the chart before making any trading decisions.
Finally, it is also important to avoid using the MACD indicator in isolation. The MACD line is only one part of a larger picture, and it should be used in conjunction with other technical indicators to get a complete picture of the market.
How to use the MACD histogram and identifying momentum reversal
The MACD histogram can also be used to measure the momentum of price movements. Momentum is the rate of change of prices, and it is measured by the difference between the current price and the price of a security at a earlier time. The MACD histogram compares the momentum of two moving averages, which makes it useful for identifying trends and trend reversals.

How to scan for MACD crosses and crossing above zero
Using Trade View X-Builder you can create automated alerts or trading signals without any coding.

If the MACD crosses up an alert will be triggered

If the MACD crosses up, the algo will Buy.

If you would like to learn more about creating automated trading strategies check out the Trading Talk series which has a new episode each week with different topics and concepts on popular automated trading strategies.
Why wait? Get started today. Sign up for an account today with our partnered broker and start creating your own automation.


