The world of technical analysis is brimming with diverse candlestick patterns, each offering valuable insights for traders. Today, we delve into the Dragonfly Doji, a unique formation that can signal a potential shift in the market’s direction.
What is a Dragonfly Doji?
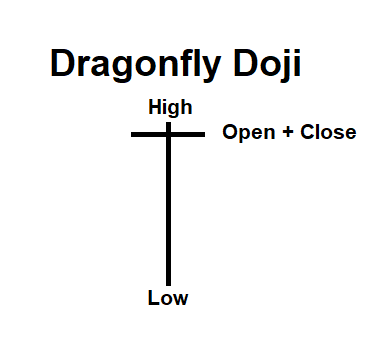
The Dragonfly Doji resembles a “T” on the chart, characterized by the following features:
- Open, high, and close prices are all (or nearly) at the same level. This forms the horizontal line of the “T.”
- A long lower wick extends downwards, signifying significant selling pressure during the trading period.
- There is a minimal or absent upper wick, indicating limited buying activity.
Interpretation and Significance:
The Dragonfly Doji typically appears at the bottom of a downtrend, suggesting a potential reversal to the upside. The long lower wick signifies selling pressure that was ultimately absorbed by buyers, pushing the price back up to close near the opening level.
However, it’s crucial to remember that no single pattern guarantees a specific outcome. The Dragonfly Doji should be considered in conjunction with other technical indicators and market context for a more complete picture.
Confirmation Strategies:
Here are some ways to confirm a potential bullish reversal signaled by the Dragonfly Doji:
- Price action following the Doji: Observe if the price moves upward in the subsequent candles, indicating a potential breakout from the downtrend.
- Volume: Look for increasing buying volume following the Doji, suggesting a stronger bullish momentum.
- Supporting indicators: Consider the confirmation of bullish signals from other technical indicators like MACD or RSI.
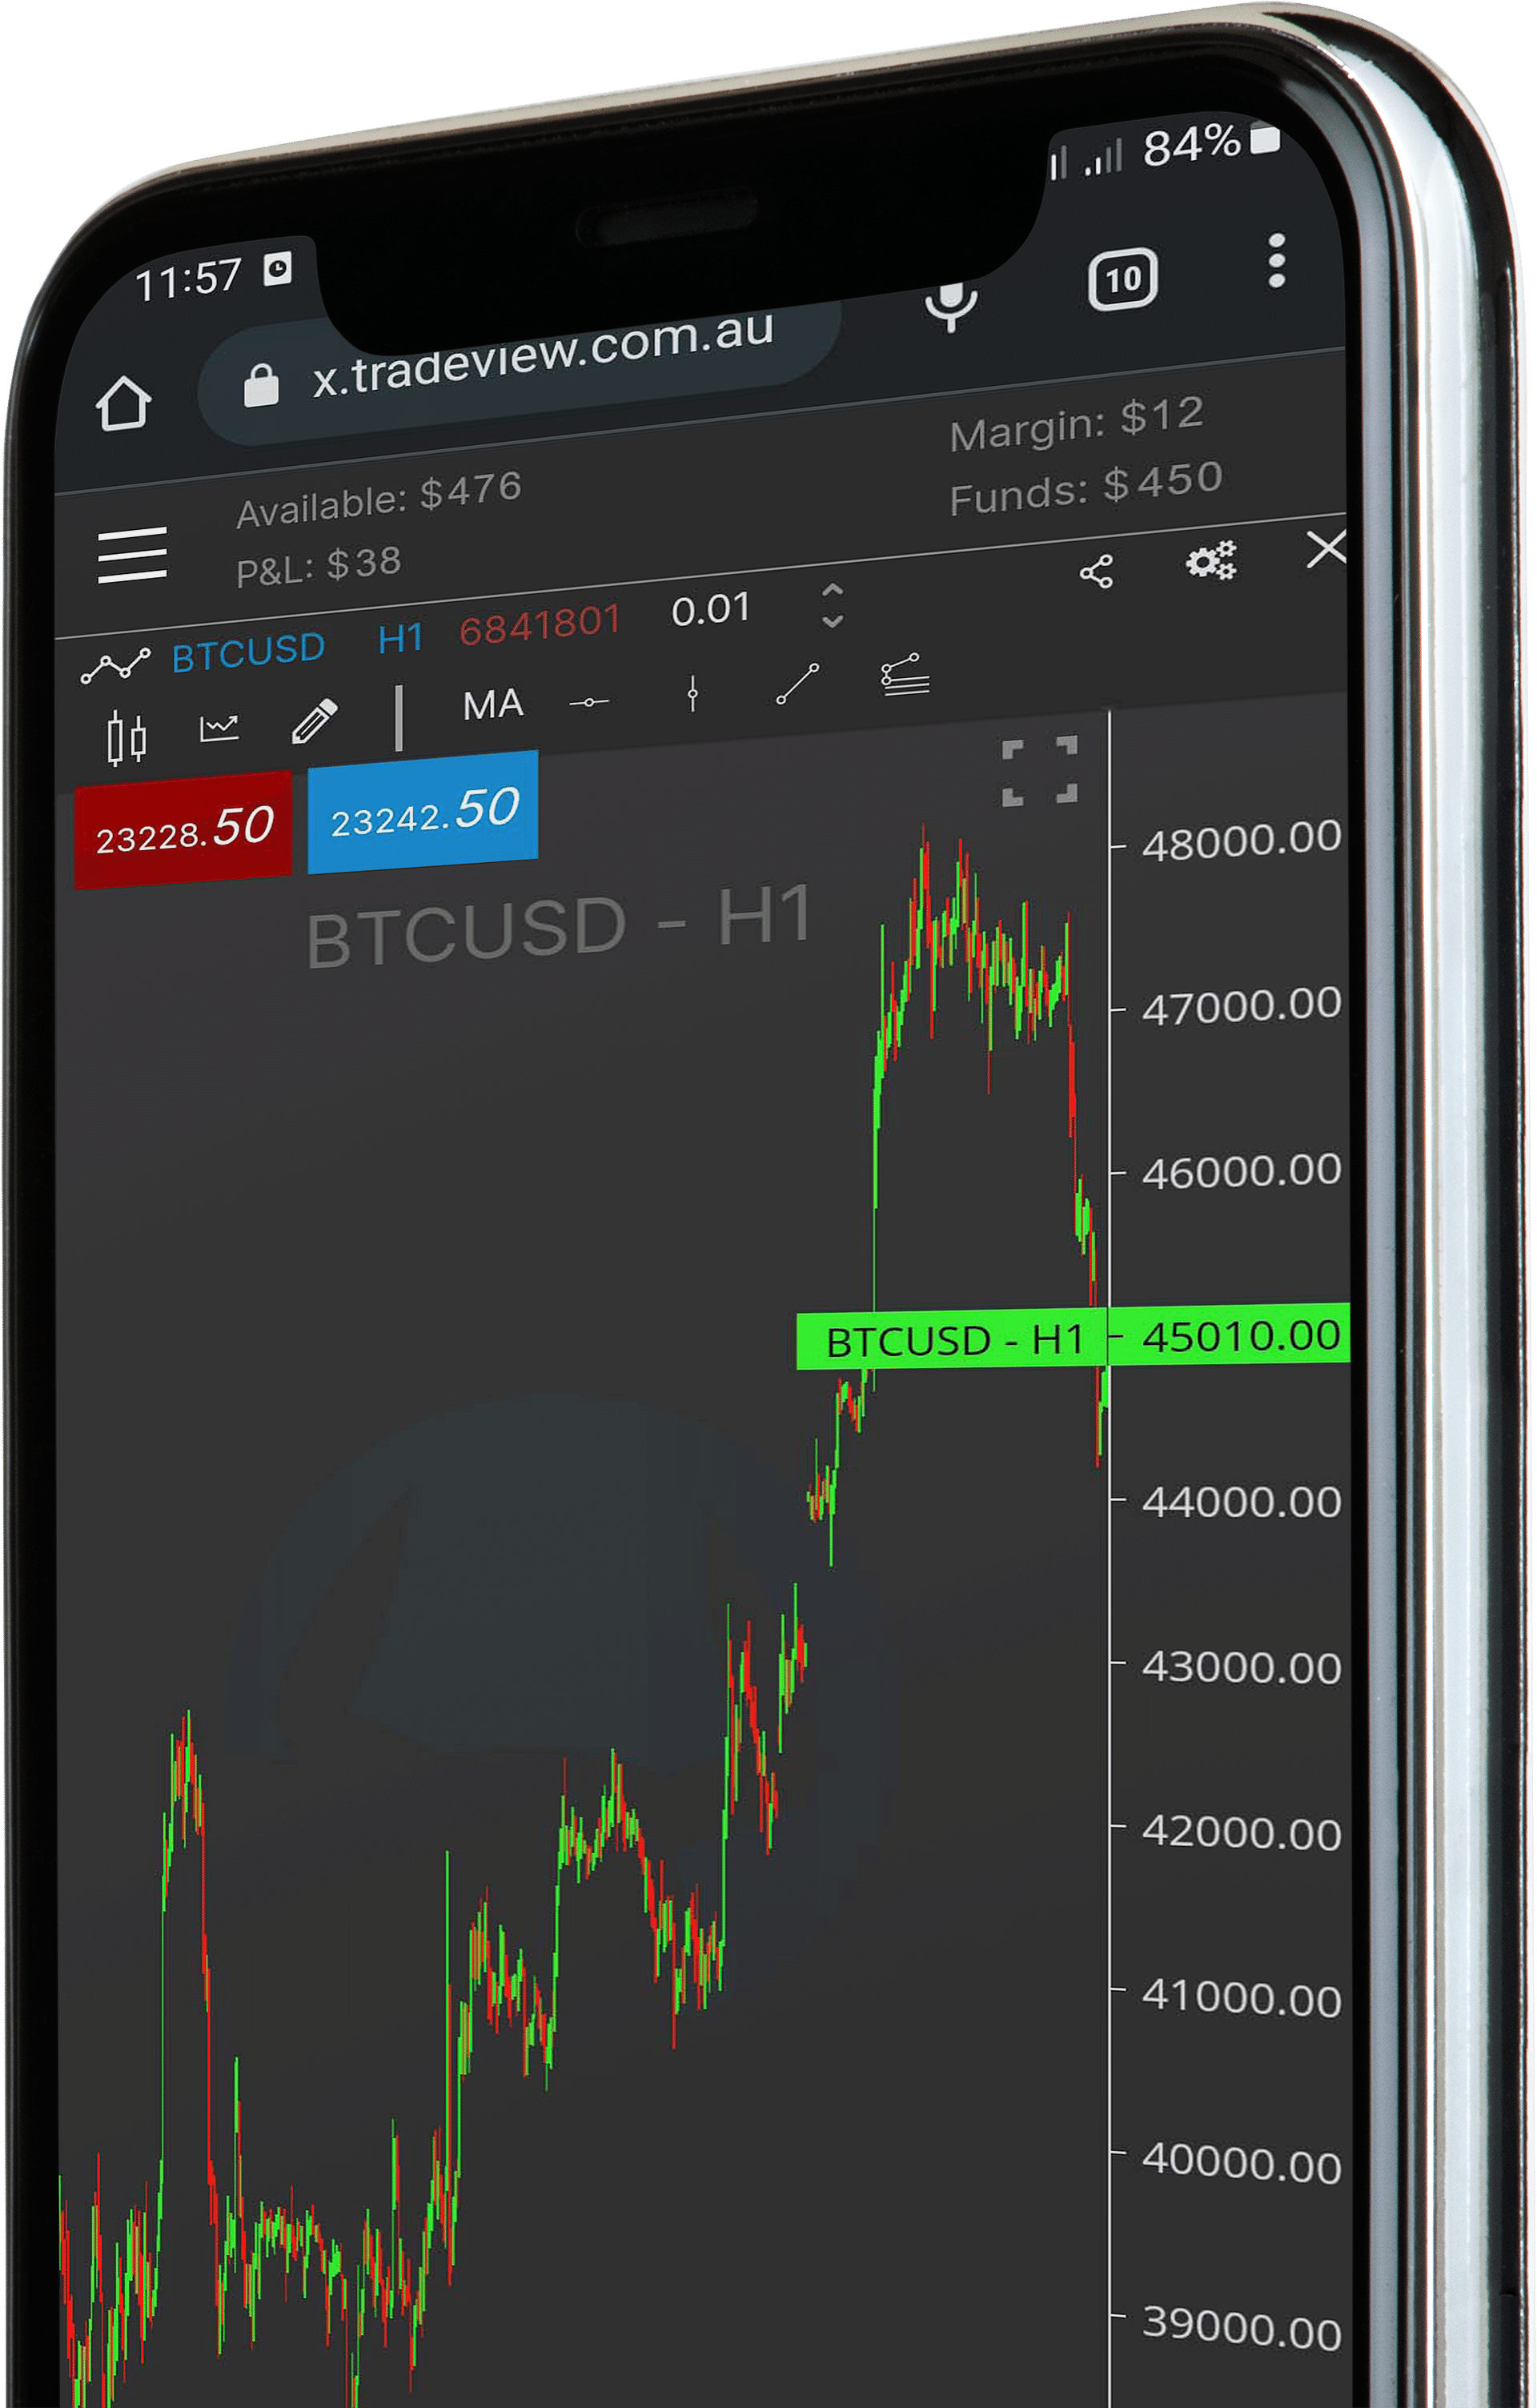
To see live trading reviews, check out the Traders Results Page.
If you would like to learn more about creating automated trading strategies check out the Trading Talk series which has a new episode each week with different topics and concepts on popular automated trading strategies.
Why wait? Get started today. Sign up for an account today with the Tradeview Forex broker www.tradeview.tech and start creating your own automation.