In this week’s episode of Trading Talk, we build out the volatility function introduced in the previous episode and walk through the key formulas step by step.
This session focuses on combining log returns, variance and standard deviation to construct a statistical framework that produces a Z-score volatility model. By translating price movement into statistical context, traders can identify when markets are moving in ways that are significantly outside normal behaviour.
Functions like this are often used to detect large market movements, abnormal volatility events and potential directional bias that may emerge during strong price shocks.
Key Points
- Step-by-step explanation of a volatility detection function
- How log returns are calculated in algorithmic trading models
- Understanding variance and standard deviation within market data
- Building a Z-score model to detect unusually large market moves
- How statistical signals can assist in identifying directional volatility
Why Z-Score Models Matter in Trading
Financial markets regularly move between periods of low volatility and sudden expansion. Statistical models allow traders to quantify these changes rather than relying on visual interpretation alone.
The Z-score framework measures how far a movement is from its historical average. When price movement exceeds normal statistical expectations, it may indicate the presence of institutional activity, macroeconomic shocks or large liquidity flows.
By integrating these calculations into algorithmic strategies, traders can develop models that automatically detect abnormal conditions across multiple markets.
Developing Algorithmic Models
Understanding the statistical structure behind price movement is an important part of developing robust trading systems.
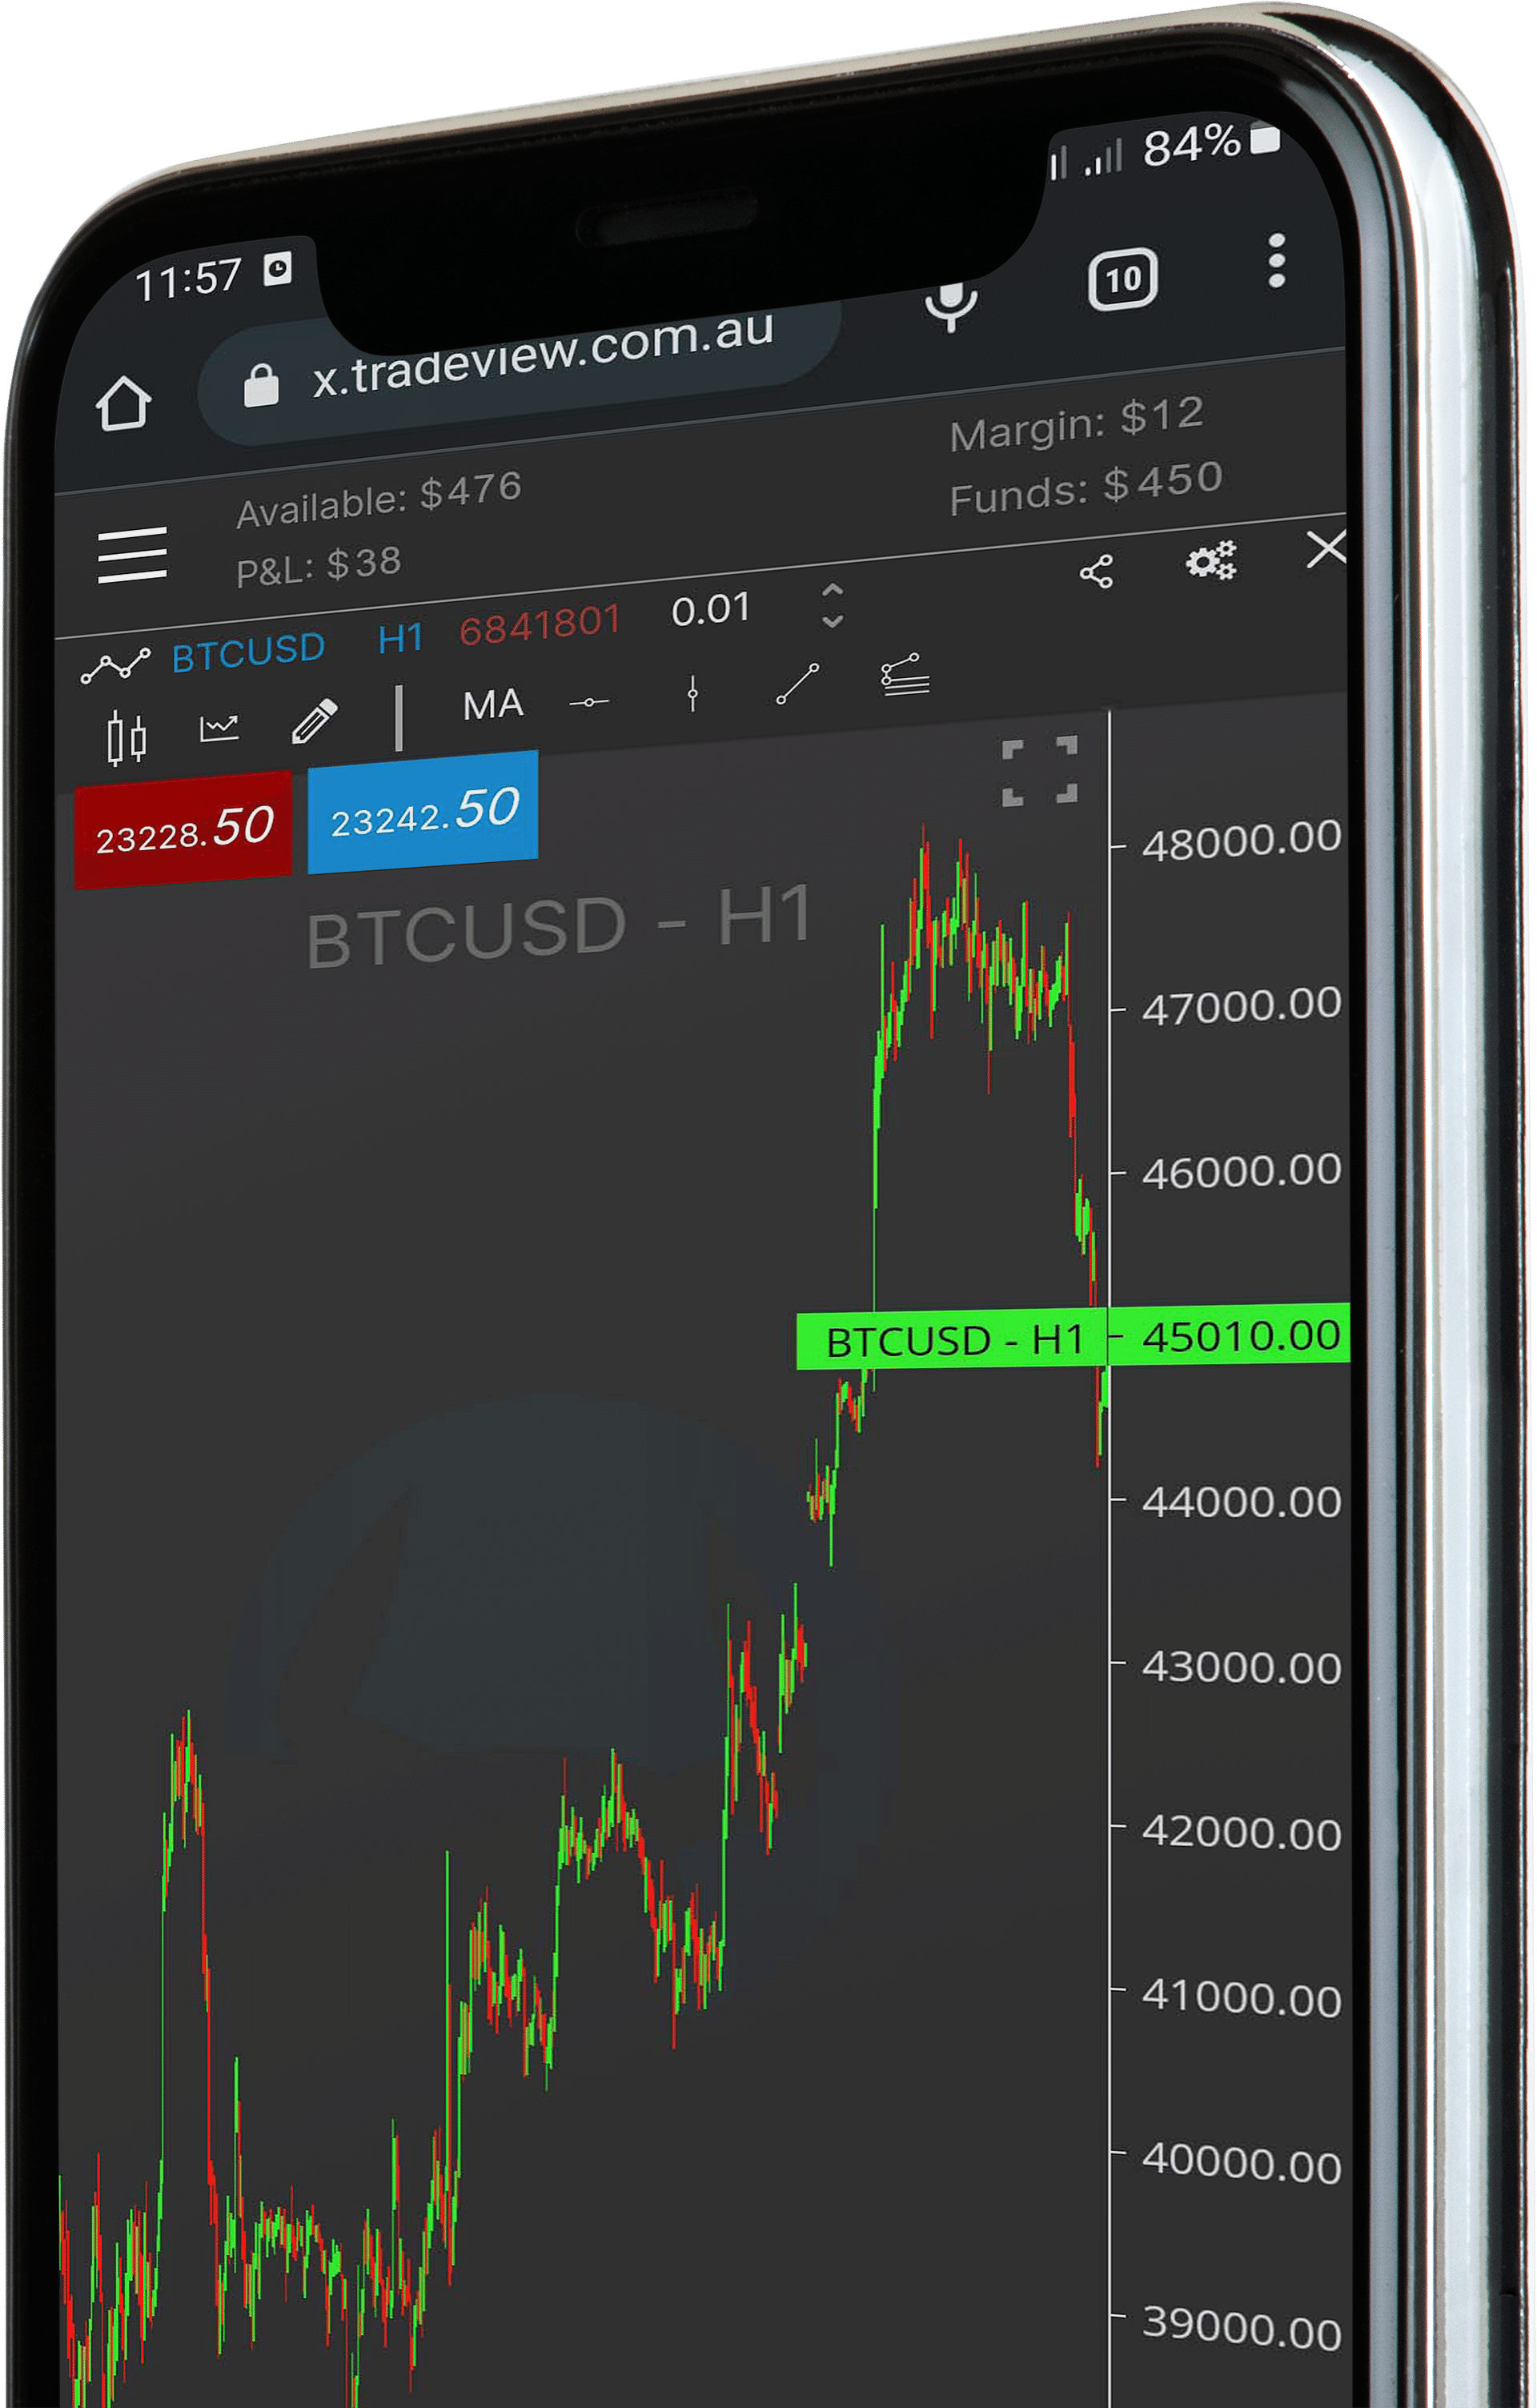
Tools such as the Trade View X platform allow traders to test, build and deploy algorithmic strategies while working with quantitative functions like the model demonstrated in this episode.
For traders who want to learn how to develop models from the ground up, the Build Your Own Algo training program walks through the full process of developing and testing algorithmic strategies.
2026 Algo Trading Conference
2026 marks the 10th annual Algo Trading Conference, where we focus on practical models built from techniques used by professional traders around the world.
The conference covers system design, volatility modelling, portfolio construction and strategy management across a decade of trading research.
To learn more or secure your ticket, visit the Algo Trading Conference page or call the Trading Desk for further details.